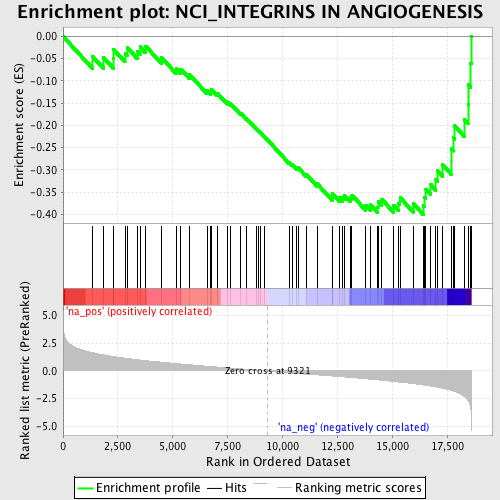
Profile of the Running ES Score & Positions of GeneSet Members on the Rank Ordered List
| Dataset | set03_wtNotch_versus_absentNotch |
| Phenotype | NoPhenotypeAvailable |
| Upregulated in class | na_neg |
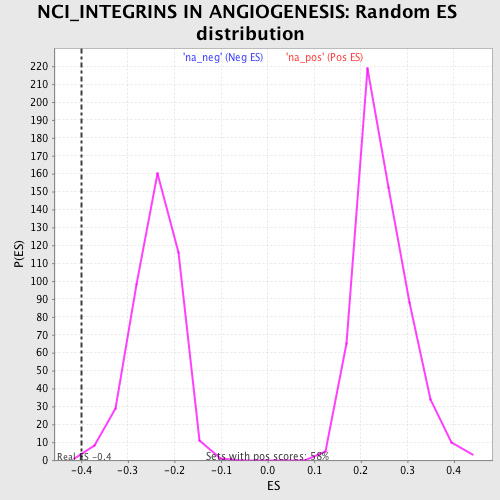
| GeneSet | NCI_INTEGRINS IN ANGIOGENESIS |
| Enrichment Score (ES) | -0.40020654 |
| Normalized Enrichment Score (NES) | -1.6690336 |
| Nominal p-value | 0.0023584906 |
| FDR q-value | 0.56668353 |
| FWER p-Value | 0.989 |
| PROBE | GENE SYMBOL | GENE_TITLE | RANK IN GENE LIST | RANK METRIC SCORE | RUNNING ES | CORE ENRICHMENT | |
|---|---|---|---|---|---|---|---|
| 1 | ROCK1 | 1338 | 1.656 | -0.0448 | No | ||
| 2 | COL4A3 | 1836 | 1.460 | -0.0475 | No | ||
| 3 | RHOA | 2286 | 1.305 | -0.0502 | No | ||
| 4 | ROCK2 | 2293 | 1.303 | -0.0290 | No | ||
| 5 | PIK3CA | 2821 | 1.156 | -0.0384 | No | ||
| 6 | RELA | 2917 | 1.129 | -0.0249 | No | ||
| 7 | MAPK3 | 3384 | 1.017 | -0.0332 | No | ||
| 8 | ILK | 3507 | 0.989 | -0.0235 | No | ||
| 9 | TLN1 | 3759 | 0.932 | -0.0217 | No | ||
| 10 | GSN | 4491 | 0.790 | -0.0480 | No | ||
| 11 | TGFBR2 | 5156 | 0.666 | -0.0728 | No | ||
| 12 | PXN | 5362 | 0.631 | -0.0735 | No | ||
| 13 | IRS1 | 5766 | 0.562 | -0.0859 | No | ||
| 14 | FGF2 | 6569 | 0.428 | -0.1221 | No | ||
| 15 | SRC | 6721 | 0.404 | -0.1236 | No | ||
| 16 | ITGB3 | 6756 | 0.399 | -0.1188 | No | ||
| 17 | CASP8 | 7028 | 0.354 | -0.1276 | No | ||
| 18 | ANGPTL3 | 7482 | 0.280 | -0.1474 | No | ||
| 19 | MAP3K14 | 7631 | 0.258 | -0.1511 | No | ||
| 20 | MAP3K1 | 8101 | 0.189 | -0.1733 | No | ||
| 21 | PIK3R1 | 8356 | 0.150 | -0.1845 | No | ||
| 22 | GPR124 | 8829 | 0.073 | -0.2087 | No | ||
| 23 | NFKB1 | 8893 | 0.063 | -0.2111 | No | ||
| 24 | AKT1 | 9010 | 0.047 | -0.2166 | No | ||
| 25 | MFGE8 | 9175 | 0.022 | -0.2250 | No | ||
| 26 | PIP5K1A | 10312 | -0.158 | -0.2837 | No | ||
| 27 | MMP9 | 10448 | -0.179 | -0.2880 | No | ||
| 28 | FOS | 10648 | -0.208 | -0.2953 | No | ||
| 29 | VTN | 10710 | -0.218 | -0.2950 | No | ||
| 30 | BCAR1 | 11071 | -0.278 | -0.3098 | No | ||
| 31 | KDR | 11574 | -0.346 | -0.3311 | No | ||
| 32 | CHUK | 12262 | -0.448 | -0.3607 | No | ||
| 33 | PTK2B | 12267 | -0.449 | -0.3536 | No | ||
| 34 | RAC1 | 12586 | -0.496 | -0.3625 | No | ||
| 35 | SDC1 | 12730 | -0.519 | -0.3617 | No | ||
| 36 | MAPK1 | 12809 | -0.532 | -0.3571 | No | ||
| 37 | RPS6KB1 | 13079 | -0.575 | -0.3621 | No | ||
| 38 | CD47 | 13164 | -0.587 | -0.3569 | No | ||
| 39 | PIK3C2A | 13786 | -0.698 | -0.3789 | No | ||
| 40 | EDIL3 | 14007 | -0.735 | -0.3786 | No | ||
| 41 | PTPN11 | 14344 | -0.802 | -0.3835 | Yes | ||
| 42 | VAV3 | 14353 | -0.803 | -0.3707 | Yes | ||
| 43 | CDKN1B | 14528 | -0.836 | -0.3663 | Yes | ||
| 44 | SYK | 15062 | -0.946 | -0.3794 | Yes | ||
| 45 | JUN | 15285 | -0.989 | -0.3751 | Yes | ||
| 46 | F11R | 15354 | -1.005 | -0.3622 | Yes | ||
| 47 | VEGFA | 15961 | -1.145 | -0.3760 | Yes | ||
| 48 | ITGAV | 16412 | -1.257 | -0.3795 | Yes | ||
| 49 | VCL | 16483 | -1.276 | -0.3622 | Yes | ||
| 50 | MMP2 | 16533 | -1.290 | -0.3436 | Yes | ||
| 51 | CSF1R | 16745 | -1.356 | -0.3326 | Yes | ||
| 52 | NFKBIA | 16992 | -1.433 | -0.3222 | Yes | ||
| 53 | HSP90AA1 | 17051 | -1.457 | -0.3013 | Yes | ||
| 54 | FN1 | 17290 | -1.556 | -0.2885 | Yes | ||
| 55 | CSF1 | 17684 | -1.733 | -0.2811 | Yes | ||
| 56 | IGF1R | 17685 | -1.733 | -0.2525 | Yes | ||
| 57 | CBL | 17780 | -1.792 | -0.2280 | Yes | ||
| 58 | SPP1 | 17835 | -1.828 | -0.2007 | Yes | ||
| 59 | IGF1 | 18285 | -2.285 | -0.1873 | Yes | ||
| 60 | MAPK8 | 18456 | -2.662 | -0.1525 | Yes | ||
| 61 | CD44 | 18469 | -2.701 | -0.1086 | Yes | ||
| 62 | PLAU | 18579 | -3.288 | -0.0603 | Yes | ||
| 63 | PTK2 | 18604 | -3.772 | 0.0006 | Yes |